Questions? (800) 322-8366

Chloramine and Its Effects on Rubber

Posted on

Chloramine and Its Effects on Rubber

Written by Dale T. McGrosky

Chloramines, or monochloramines, are used as a secondary disinfection process to treat drinking water by water utility companies. Chloramines are a disinfectant typically formed when ammonia is added to chlorine treated water.
Chlorine is a primary disinfection process that is effective and quick at killing infectious diseases, however, chlorine treating looses its effectiveness over time and because of this is not affective at killing bacteria and viruses as the water moves though pipes. Chloramine is more stable and is more affective than chlorine at killing bacteria and viruses found in the pipes that are used to transfer water. Chloramines are not affective as a primary disinfectant because they take much longer to kill harmful organisms making it impractical for most water utilities.
Chloramines have become an issue in the past several years as its use as a disinfectant in drinking water increases. Chloramines can deteriorate rubber and plastic and corrode metal, all found in faucets, shower heads, toilet valves and other applications.
There are elastomers that are chloramine resistant. Peroxide cured silicones and fluorocarbons do well but can be a costly alternative to standard sulfur cured nitrile and EPDM compounds. Peroxide cured EPDM have shown to do well with chloramines and are only moderately more expensive than its sulfur cured equivalent. Chloramine testing can be performed on elastomers, however, this testing is expensive costs around $2,500 for a 3 week test and $5,000 for a 6 week test.

Chloramine Resistance Testing

ASTM D6284, Standard test Method for Rubber Property – Effects of Aqueous Solutions with Available Chlorine and Chloramine, is the designated specification for testing the effects of chloramine on rubber. Basically the test has you mix a solution, in this case a 50ppm monochloramine solution, and soak samples for a designated period of time. Weekly testing can be performed on the samples to record the hardness, mass and volume changes as well as note any degradation of the material. Most common test is 3 weeks, however, some compounds have shown not to significantly change until around 4 weeks or more. Therefore, we recommend a 6 week test be performed.
Call the experts at Satori Seal for your chloramine resistant sealing requirements.

Compound Identification in Quality Control

Posted on

Compound Identification in Quality Control
Are you getting the correct compound?

Written by Dale T. McGrosky

One of the most important, yet least frequently checked, quality control procedures is to verify the type of compound on your parts. You may receive certification stating that these parts are indeed the specific compound you requested, but what test was performed to back up the certification and who was the last to verify the compound and what method was used?

We have come across several methods of identifying rubber materials like measuring specific gravity, burn testing, Infrared spectroscopy, chemical analysis, the list goes on. Identifying materials with methods such as measuring specific gravity or burn testing will help you identify the type of material but these methods will not identify a specific compound. Chemical analysis, although very conclusive is very expensive and time consuming making it impracticable for everyday use. When it comes to a safe, quick, accurate, and conclusive method of material and compound identification that can be used safely everyday, our choice was the Fourier Transform Infrared Spectrometer (FT/IR). With the FT/IR we are able to identify materials easily and quickly and use this in our everyday quality inspection assuring our customers are getting the exact compound they ordered.
Specific Gravity (Density)

Lets go over some definitions first. Density is the mass of an object per unit of measure. For instance aluminum has a density of 2.8 g/cm3. The formula for density is Density (p) = Mass (g) / Volume (cm3). Specific gravity is a dimensionless unit that is defined as the ratio of density to the density of water at a specific temperature. Water at 4°C (39°F) has a density of 1.000 g/cm3.

Even though lbs/in3 (pounds per cubic inch) is often used, it is not the correct imperial (U.S.) unit of measure for density since pounds is defined as a measure of force. The correct imperial (U.S.) unit of measure for mass is the slug; therefore, the correct unit of measure for density is slugs/in3.
1 pound = .03108095 slugs.

Specific gravity is a good method of identifying a type of material or checking the accuracy of a compound. Each material has a different specific gravity and this can be useful in identifying a type of material. If you have a specific compound and know the specific gravity of that compound you can compare the specific gravity of the parts from that compound against the specified specific gravity to verify the accuracy of that compound. The acceptable tolerance for specific gravity in rubber compounds is ±0.02 (remember, specific gravity has no unit of measure). Although this method is good in identifying types of materials or checking the accuracy of a specific compound, in some cases it is not conclusive enough and further testing may be required to properly identify a material. One example is EPDM vs. Nitrile material identification.

EPDM and Nitrile have very close specific gravities. Most Nitrile compounds have a specific gravity around 1.23±0.02 and EPDM can come in around 1.20±0.02. Depending on the scale resolution, the sample size and operator accuracy, getting a conclusive identification between these two materials by specific gravity alone may not be possible and other methods such as a soak test may have to be used to assist in the identification process.

Specific gravity is a good method to identify the basic material such as Nitrile, EPDM, Silicone, Fluorocarbon, etc. but it may not be conclusive enough to determine the difference between two specific compounds such as a standard EPDM and an EPDM FDA Grade.

Burn Testing (Burning rubber is NOT recommended because some compounds can form highly toxic fumes.)
Another early method was to burn test the material and observe the ash, smell and burn characteristics of the material. Nitrile has a very distinct smell and if done in the office most of your colleagues will be quite upset with the lingering smell that has permeated their nostrils. Silicone, when burned has a white ash, Fluorocarbon won’t support combustion, when Chloroprene (Neoprene®) is burned in the presence of hot copper it will cause the flame to glow green (Beilstein Test). The list goes on depending on the type of material.

It is NOT a good idea to inhale the fumes from burning rubber. When you find it necessary to burn test rubber such as the Beilstein Test, this should be done in a well ventilated area and every precaution should be taken so the fumes are NOT inhaled.

Infrared Spectroscopy

The FT/IR is a device that shoots infrared radiation (energy), into a sample and measures the amount of IR radiation that is absorbed and transmitted by the chemical bonds between atoms in a molecule. The information is collected and a unique molecular fingerprint of the sample is created. Illustration 3 shows a graph of an EPDM compound. The graph shows the amount of energy absorbed at a specific wavenumber (cm-1). Different chemical bonds in the molecule will produce different peaks in the wavenumber range. The height of the peak shows the amount of energy absorbed at that wavenumber. The more of that type of molecular bond in the molecule, the more energy that will be absorbed creating a higher peak. With this information we can identify materials, types of molecular structures in the material and creates a unique fingerprint for each compound.

In order to understand the FT/IR scan, lets look at the chemical structure of and EPDM molecule as shown in illustration 2 and compare it to the FT/IR scan of an EPDM compound in illustration 3. But, before we get started lets take a look at how molecules vibrate.


Figure Caption “Illustration 1: Vibrational modes of molecules”

Molecules vibrate by bending or stretching. They stretch symmetrically or asymmetrically. They bend “In Plane” by rocking or scissoring and “Out of Plane” by wagging or twisting. You can see this in illustration 1. Each one of these vibrations will absorb energy at a particular wavenumber depending on the two atoms that are bonded.
In the chemical structure of EPDM, illustration 2, you can see methylene, CH2; Methyl, CH3; carbon-hydrogen bonds, CH; carbon-carbon bonds, C-C; and carbon-carbon double bonds C=C. Now take a look at illustration 3 and you can see where I identified the corresponding peaks. For instance you can see the CH2 Asymmetrical stretch at 2918 cm-1 and the CH2 Symmetrical Stretch at 2849 cm-1 and the CH2 Rocking at 722 cm-1. When we are identifying a compound with Acrylonitrile such as ABS, Nitrile (Buna), we look for the carbon-nitrogen triple bond, C≡N, peak between 2260 cm-1 and 2240 cm-1.


Figure Caption “Illustration 2: Chemical structure of an EPDM molecule”


Figure Caption “Illustration 3: FT/IR scan of an EPDM compound

To identify unknown substances, we do this in reverse, you can take a scan of an unknown molecule and identify the peaks and assemble the basic molecular structure. Another method is to compare the scan against a library of known scans to help identify the unknown compound. There are several websites that offer access to libraries of known substances for a fee.


Illustration 1: The graph above was produced by FT/IR scans on two EPDM compounds. We can tell by the graph that they are both EPDM material but they are not the same compound as shown by the two peaks present at wavenumber 1539 cm-1 and 1397 cm-1 in Sample 2 that are not in sample 1.

We used the FT/IR to help resolve an issue for a company that had a problem. They sell an NSF Certified product that contains EPDM O-rings. Since they purchase NSF Certified O-rings from 2 different suppliers, this company wanted to check if the failed O-rings were from vendor 1 or vendor 2. We received several o-ring samples identified as “Failed O-rings” — Sample 1, and O-ring samples taken from the same batch that were sent to the customer – Sample 2. Our objective was to determine if Sample 1 was the same compound as Sample 2. As shown in illustration 4, the two scans are similar and we were able to determine that these samples were EPDM material but the two peaks at wavenumber 1539 cm-1 and 1397 cm-1 in Sample 2 are not in Sample 1 indicates that these compounds are different. Our conclusion was these samples were both EPDM but they were not the same compound.

We looked at several methods of identifying compounds. Specific Gravity and burn testing will help identify the material but does not help much in identifying a specific compound. Chemical analysis is accurate and conclusive but is slow and costly. Our preference at Satori Seal for a quick method of compound identification for use in our quality control inspection is the FT/IR. With the FT/IR we identify and match compounds, we fingerprint our compounds allowing us to quickly scan actual parts and get a conclusive identification assuring our customers that they are getting the compound they ordered.

Elastomer Hardness Gages, Type A vs. Type M

Posted on

Elastomer Hardness Gages, Type A vs. Type M

Written by Dale T. McGrosky

For decades rubber hardness was measured with a type A durometer gauge. According to ASTM D2240, “Standard test Method for Rubber Property — Durometer Hardness,” you need a 6mm (.240 inch) min thick piece of rubber and large enough to be 12mm (.480 inch) away from the edge and previous test point. This and the geometry of the gauge make it unsuitable for measuring small cross section O-rings or thin pieces of rubber. Shore Instruments came out with the Type M gauge, Micro O-Ring System, specifically for measuring small cross section O-rings and thin pieces of rubber (not less than 1.25mm thick). This system was designed to give similar reading to the type A gauge, but the gauges will not yield exactly the same reading. It is not uncommon to get 4-5 points difference in the readings (given that all gages are properly calibrated). These scales are different, and according to Instron, there is no correlation between the Shore A and Shore M scales. In other words you can not measure a piece of rubber with a type M gage and convert the reading to type A scale and vice versa.

The major differences between the type A and Type M durometer gauges are the indenter geometry (its shape) the spring force on the indenter and the size of the foot. The type A gage has a “Frustum Cone” indenter with 821 gram max spring force. The type M gauge has a sharp 30° angle indenter with a 78 gram max spring force. The type M has a much smaller diameter indenter, .7874mm (.030 inches), with a sharp point as compared to the larger diameter type A indenter, 1.27mm (.050 inches) with a .79mm (.031 inch) diameter flat bottom instead of a point.

When you have a durometer Type A gauge calibrated, after calibration it is accurate to only +/-2 points. After calibrating a type M gauge it is accurate to +/-4 points. It’s repeatability (variation caused by equipment) and reproducibility (variation caused by the operator) are not real accurate. Hardness instruments with a GR&R study of 10% to 30% is acceptable in most industries. Repeatability and reproducibility can be calculated by performing a Gage R & R Study. (Google Gage R & R and you will find several web sites that will describe how to perform this study). What this means is, it is not uncommon to get different readings from the same operator (repeatability) and different reading from two or more operators (reproducibility) on the same rubber samples.

Factors like temperature, humidity, the rate at which you apply the gage, how much pressure you apply to the gage, how the test specimens were conditioned prior to testing will effect your readings. This is why we recommend using a durometer gage on a conveloader stand such as the Shore Instruments CV71200 Conveloader for the type A gauge. The conveloader controls the rate of application, the amount of force applied to the gauge and keeps the gauge’s indenter perpendicular to the sample which help to increase repeatability and reproducibility of your readings.

Basic O-Ring Seal Design Criteria

Posted on

Basic O-Ring Seal Design Criteria

Written by Dale T. McGrosky

There are so many different types of seals and sealing principles that to try to cover them all would require writing a book. So, to cover the basics we will talk about design criteria for O-ring seals. This should give you a basic start into sealing principles and what to consider when designing a seal for your application.

Types of O-Ring Seals
1st thing to consider is how is this seal going to seal? Is it static, nothing moves once installed, or dynamic, the seal or sealing surface rotates or reciprocates in the application. Does the O-ring seal
axially or radially. Axially is when the O-ring is squeezed from the sides perpendicular to the parting line or, if you think of the O-ring as a wheel, in line with the axle. Radially would be squeezed
perpendicular to the axle or in line with the O-ring parting line. So, we have static axial, static radial, dynamic axial and dynamic radial O-ring seals. Each type of seal is going to have it own design criteria to consider. There are other O-ring seal types like thread seals, tapered seats, or boss fittings which we will not consider in this article. SAE.org is a great place to start you search for design criteria. They have many military and aerospace design documents available for sale. A great start is ARP1231, “Gland Design, Elastomeric O-Ring Seals, General Considerations.” This specification covers many aspects to consider in O-ring seal design. Aerospace recommended Practice ARP1232, ARP1233 and ARP1234 cover O-ring gland seal design for the AS568 series O-rings. These ARP documents containgroove dimensions and stretch and squeeze specifications. These specifications are a great starting point for a custom O-ring seal.

A couple of O-ring design flaws we encounter the most is excessive stretch and not enough groove width. The O-ring should not be stretch more than 5% max. Also, rubber O-rings are subject to the Poisson’s Effect (Poisson’s ratio). When solid rubber is compressed in one direction it expand in the other direction. For practical purposes, rubber is non compressible and you must account for the Poisson’s Effect this in the design of your groove width.

Tolerances
Many of the design specification take into consideration the tolerances of the O-rings in their given sealing gland dimensions. However, when you are straying from a standard design specification you must take into consideration the applicable tolerances for the type of seal you are designing. Will the seal work on the low end of the tolerances and also on the high end of the tolerances? Simple calculations can be done to check the seals stretch and squeeze at each end of the applicable tolerance range. Don’t forget to consider the tolerances of all parts associated with the sealing gland.

Compound Selection
There are 36 types of elastomer compound and the proper selection is an important part of your design. Selecting the wrong compound can cause premature failure in your application. Operating temperature, fluid resistance and whether the seal is dynamic or static are the 3 main questions I ask when selecting a compound. Weathering or ozone exposure , friction characteristics, abrasion resistance, compression set, elongation, tensile strength are other physical properties to consider in your selection. Below are the more popular material that are readily available. There are also many chemical compatibility charts available on the internet to assist you in selecting a compound suitable for the fluid in your application.

Common NameASTM D1418Chemical Name
Nitrile, BunaNBRAcrylonitrile-Butadiene
* sometimes referred to as Buna-N
Ethylene propylene, EPEPDMEthylene Propylene Diene Monomer
FKM, Viton®FKMFluorocarbon
SiliconeVMQ, PVMQPolysiloxane
* Not to be confused with the chemical element Silicon.
FluorosiliconeFVMQpoly (trifluoropropyl) methylsiloxane
Neoprene®CRChloroprene
Hydrogenated Nitrile, HSN, HNBRHNBRHydrogenated Acrylonitrile-Butadiene
Styrene ButadieneSBRStyrene Butadiene
* Initially marketed as as Buna-S
Natural RubberNRCis-polyisoprene
IsopreneIRcis-polyisoprene, synthetic
ButylIIRIsobutene-Isoprene
TFE/P, Aflas®FEPMTetrafluoroethylene-Propylene (TFE/P)
PolyurethaneAU, EUPolyester-urethane, polyether- Urethane

Viton® and Neoprene® are registered trademarks of DuPont Dow Elastomers.
AFLAS® is a registered trademark of the Asahi Glass Co., Ltd.

Hardness
Elastomer compounds range from very soft, 20 Shore A, to very hard, 90 Shore A. Rubber comes in various hardness’ for several reasons. The sealing surface should range from 8 to 32 micron finish. That is pretty smooth. There are cases were the sealing surface may be porous or wavy such as is case metals and plastic moldings. Softer rubbers will fill in the small voids, pits and scratches that are pathways for fluid to escape. Softer rubbers are also easier to squeeze which can be useful during installation on some applications.

Harder rubber is most commonly used in high pressure applications, up to 1500 psi, to prevent the seal from extruding into the space between the two sealing surfaces. This will cause bits of rubber to be nibbled away eventually leading to the seal failing.

Coefficient of friction is effected by the hardness of the rubber. Softer rubbers will cause higher breakout and kinetic friction on dynamic seals compared to harder rubbers.

Prototyping
Before going to production on your new seal, getting prototypes made is a great way to check your design work. There are several ways to prototype your O-ring design, cut and splice, prototype tooling, and cast mold via stereo lithography.

An O-ring can be made from cord stock or other o-rings that are cut to length and the ends glues together. This can be done fast and cheap but slight leaking can occur around the splices. A more
accurate samples can be made from a 1 cavity prototype tool. This is more expensive, but less than a production tool, and does take time to have the tool made and samples run in production.
Another option is to have the seal made from stereo lithography (SLA). A sample part is generated with SLA. This sample is used to make a cast mold. Cast parts can be made from this. Turn around on
this can be quicker than a prototype tool but this is more costly and the prototype part may be silicone and not the compound you need for production.

Coefficient of Friction and Rubber

Posted on

Coefficient of Friction and Rubber

Written by Dale T. McGrosky

How many times have you heard “What is an O-ring?” Without knowing it, O-rings are used in so many things in our daily lives and we just aren’t aware of it. Friction is the same way. We rely on friction in our daily lives. For instance, friction is what keeps our tires glued to the road so your vehicle doesn’t slide out of control. Tires without friction would be like driving on ice. I know, many of you are thinking “What about walking on ice?” It’s the same thing, we rely on the friction between the soles of our shoes and the ground to keep us from slipping. By now I am sure the wheels are turning in your head and you’re probably thinking of many other examples where the friction, or lack of friction, between two surfaces benefits us.

Friction is a force that opposes the movement of one object against another.  There are three type of frictional forces, static, limiting and kinetic.

Static friction is the friction acting on and object when there is a force applied to the object while it is not moving. Lets explain this. Take an O-ring, or something that is not very slippery, and put it on a desktop. With your hand start to push on the o-ring in the direction you want it to slide without actually making it move. Now you are applying a force on the O-ring and it is not moving. Why? Because static friction is opposing the force you are applying to the O-ring. The frictional force is stronger than the force you are applying to the O-ring preventing it from sliding.

Limiting friction is the friction acting on an object just before it begins to move. This is often called breakout friction or its breakout point. Limiting friction is usually the highest friction, meaning, it usually takes more force to get something moving than to keep it moving. Lets explain this further. Ok, you should still have your hand on your O-ring and applying a force to it without making the o-ring move. Now, gradually increase the amount of force you are applying to the O-ring until it starts to move. Did you notice that once the o-ring started to move it required less force to keep it moving than it did to start it moving. Try it again but pay attention to the amount of force you are applying to the o-ring until it starts to move. The point just before the O-ring starts to move is called the limiting friction. It is were the frictional force is at its highest, usually.

Kinetic friction is the friction acting on an object while it is moving. To explain this one lets do a little comparison. You felt the frictional forces on the o-ring as you applied force to it while it was moving– right? Now, do the same thing to a piece of ice that you did with the O-ring. You will find that it takes less force to slide the ice across the desktop than the o-ring. This is because there is less kinetic friction between the ice and the desktop than the O-ring against the desktop. There is less frictional force opposing the ice moving on the desktop than the O-ring. Parents, this sounds like a pretty cool science fair project huh?

Friction is originated from electromagnetic forces and exchange forces between atoms and molecules. Electromagnetic forces and exchange forces (strong force) are two of the 4 fundamental forces, strong force,  electromagnetic, weak force and gravity. Exchange force is any force that has to do with the exchange of particles. Technically all 4 forces can be classified as an exchange force.

Electromagnetic force is the force which holds the atoms together and keeps the electrons from flying off somewhere away from the atoms nucleus and also holds the atoms together to form molecules. You  probably heard the phrase, “Like charges repel, opposite charges attract.” Two positive or two negative  particles will repel while a positive and a negative particle will attract. Atoms are made up of neutrons (neutrally charged), protons (positively charges) and Electrons (negatively charged). The nucleus contains the protons and neutrons. The electrons travel around the nucleus in orbits similar to the planets in our solar system revolve around the sun. Neither the planets or electrons fly away because they are held in place by exchange forces. Electrons by the electromagnetic force and planets by gravity or gravitational force. It is the electromagnetic force that also keeps atoms together in molecules and causes an attraction or repulsion between two atoms.

Strong force (exchange force) is a fundamental force that acts on the nucleus of and atom. It is the force that binds particles together to form the neutrons and protons in the atom. The strong force is the strongest force. It can cause two protons to hold together despite the fact they are both positively charges and want to repel due to the electromagnetic force. The attraction of the strong force is stronger than the repulsion of the electromagnetic force.

So what do these forces have to do with friction? Certain molecules are going to attract to each other increasing frictional forces and some molecules repel reducing frictional forces. Lets look at what some call the most slippery material on earth – polytetrafluoroethylene (PTFE) or commonly referred to by its trade name Teflon®. PTFE is a long string of carbon atoms joined together with two fluorine atoms attached to each carbon atom. Fluorine, when attached to a molecule doesn’t like any other molecule around it. It repels any other molecule even other molecules with fluorine atoms, hence its low coefficient of friction or slipperiness.

Coefficient of Friction
Lets say while you are sliding the O-ring across the desktop and you slide it through some grease left over from your french fries at lunch and suddenly the o-ring moves very easily with little force. You just modified the frictional coefficient or “Coefficient of Friction” with a lubricant. The same thing can be done to O-rings or rubber parts to reduce the coefficient of friction. 3 things can be done to reduce the coefficient of friction on rubber parts. You can coat the surface with a lubricant, add an internal lubricant to the compound, or modify the surface with fluorine, also called surface modification.

A lubricant can be applied to the surface of a rubber part to reduce the coefficient of friction. Some of the more common lubricants are silicone, molybdenum disulfide(MoS2), talc (baby powder), graphite, carnuba wax.  These are temporary and do not stay on very long. They are primarily used to make installation easier. The surface can be coated with a polytetrafluoroethylene (PTFE or more commonly called Teflon®). PTFE coating is a thin layer of PTFE applied to the surface and them baked on in an oven. This is a little more permanent but can wear off or be scratched of the rubber. PTFE coating is not only used to reduce the coefficient of friction but the coatings are available in several colors which makes for great part identification on assembly lines. Another method of surface coating rubber is called chlorination.  The rubber is  introduced to chlorine gas which causes micro cracks on the surface which holds an external lubricant. This method is more permanent than PTFE coating.

Another method of lubricating rubber is to add a lubricant to the rubber compound as it is being mixed. The internal lube will slowly leach to the surface over time. This is great for dynamic applications where the rubber seal is moving during its use. Common internal lubricants are carnuba wax, PTFE, molybdenum disulfide (MoS2), graphite.

The newest method of reducing the coefficient of friction is “Surface Modification.” In this method the hydrogen atoms that are bonded with carbon atoms on the surface of the rubber are replaced with fluorine atoms. Remember fluorine above in the PTFE? When fluorine is bonded to a molecule it doesn’t like other molecules — It repels them making the molecule slippery. Also, fluorine is the most electronegative element. Electronegativity is the atoms ability to attract and share electrons with other molecules. What this means is once the fluorine atom bonds with the carbon atoms in the rubber molecule it doesn’t easily come off making this process superior. The surface modified rubber can be used in dynamic applications where the O-ring moves and needs to maintain a low coefficient of friction surface that won’t wear off.

Satori Seal can provide O-rings and seals with low coefficient of friction properties by any of the above methods. Please call on of our friendly customer service representatives at 800-322-8366 and they will be glad to assist you.

Understanding ASTM D2000 (SAE Recommended Practice J200)

Posted on

Understanding ASTM D2000
(SAE Recommended Practice J200)

Written by Dale T. McGrosky

“Standard Classification System for Rubber Products in Automotive Applications”

ASTM D2000 was introduced to provide engineers with a classification system for commercially available rubber materials and to provide a simple designation method, called the “Line call-out.” Although the title specifies automotive application it is no longer limited to only the automotive industry. In fact several industries now benefit from this standard.

ASTM D2000 standard follows the Society of Automotive Engineer’s (SAE) standard J200. As revisions are made to the J200 standard, the corresponding changes are made to the D2000 standard. ASTM D2000 was originally intended for elastomer compounds containing carbon black. However, it has become a standard for almost all elastomer compounds.

ASTM D2000-12 2BG710 B14 B34 EF11 EF21 EO14 EO34 F17 K11

Lets breakdown the “Line call-out” above.

“ASTM D2000” is the reference number for this standard.

“-90” is the revision year of the document. The latest revision year should always be used.

Now we get to the nitty gritty of the line call-out.

“M” states that the units of measure are SI (International Standard of Units). If the line call-out doesn’t have the “M” them the “Inch-Pound Units” are to be used.

Lets Jump ahead one step and skip “2” for now.

“BG” – The first letter, “B”, is the designation for Type (resistance to heat aging) as shown in table 1. The second letter, “G”, is the designation for Class (resistance to swelling in oil) as shown in Table 2. Put these two designation together and you can use table X1.1 in the ASTM D2000 specification to see what basic elastomers are used. According to Table X1.1, BG is “NBR polymers, urethanes.”

Table 1, Resistance to Heat Aging
TypeTest Temperature
A70°C (158°F)
B100°C (212°F)
C125°C (257°F)
D150°C (302°F)
E175°C (347°F)
F200°C (392°F)
G225°C (437°F)
H250°C (482°F)
J275°C (527°F)
Table 2, Tested for 70 hrs @ temperature from table 1 in ASTM Oil No 3
ClassVolume Swell, max
Ano requirement
B140%
C120%
D100%
E80%
F60%
G40%
H30%
J20%
K10%

Lets go back to “2” now.

“2” represents the grade of rubber. The grades available are shown on table 6 of the ASTM D2000 specification. The grades available are dependent on the hardness and tensile strength for the particular Type and Class material. Table 6 also shows the basic requirements of the rubber like hardness, tensile strength, elongation, heat ages properties and oil immersion, compression set (Does heat aged & oil immersion sound familiar?–Type and Class “BG”). Grade 1 indicates that only the basic requirements are required and no suffix requirements are permitted. But well get to suffix requirements in a minute.

“7” represents the hardness. In this case 7 = 70 Durometer Shore “A”

“10” represents the tensile strength. Remember the “M” from before? Here’s were it comes in.

M2BG710 = 10 MPa tensile strength minimum — SI Units

2BG710 = 1015 psi tensile strength minimum — Inch-Pound Units

Starting to get the picture? Lets continue with the next step, the suffix requirements.

Grades other than 1 are used to to show deviations or additional requirements other than the basic requirements and are listed as “Suffix Requirements.” Example: “B14 B34 EF11 EF21 EO14 EO34
F17 K11” are suffix requirements.

Each suffix requirement has a suffix letter(s) and a suffix number. The suffix letter represents the test required. The meaning of each suffix letter is shown in table 3.

The suffix number is a two digit number. The first number indicates the test method and the second number indicates the temperature of the test. table 4 in the ASTM D2000 manual shows each suffix
requirement.

Table 3, Suffix letter meanings
SuffixTest Required
AHeat Resistance
BCompression Set
COzone or Weather Resistance
DCompression-Deflection Resistance
EAFluid Resistance (Aqueous)
EFFluid Resistance (Fuels)
EOFluid Resistance (Oils and Lubricants)
FLow Temperature Resistance
GTear Resistance
HFlex Resistance
JAbrasion Resistance
KAdhesion
MFlammability Resistance
NImpact Resistance
PStaining Resistance
RResilience
ZAny Special Requirements

So lets recap the Suffix Requirements.

For each Type and Class of material there are a set of basic requirements: heat ages properties, tensile strength, elongation, oil immersion in ASTM Oil No 3 and compression set. For grades of material other than 1 there are additional requirements or deviations from the basic requirements that are shown as Suffix Requirements. Each suffix requirements is a group of letters and numbers that tell what test, the test method and temperature of the test to be performed.

Please note that you do not need to meet ALL the suffix requirements for a particular material . The suffix requirements are picked based on the qualities needed to meet the service requirements of the material. For example, you may not be particularly interested in the fluid resistance tests if the material you are picking is going to be used in an application were it will only see compressed air. If there is a special requirement that you need to meet the suffix letter  “Z” is used to note them. These requirements need to be specified in detail.

I hope this helps you to understand the ASTM D2000 Manual. I highly recommend that you have this manual on hand. This manual can be purchased from http://www.sae.org.

Using Significant Figures to Express Uncertainty in Measurements (Revised: Apr 18)

Posted on

Using Significant Figures to Express Uncertainty in Measurements

Written by Dale T. McGrosky
revised: April 2018

When performing measurements and calculations how many digits do we extend to in our final answers? This can be explained by using significant figures to express the uncertainty in measurements. Significant figures is a tool that helps determine the number of digits used in a measurement. When performing measurements and calculations, significant figures express the uncertainty in a measurement and determine how many digits are used in the final answer.

The general rules for determining significant figures are as follows:

Any nonzero digit123, 1.23, .123 all have 3 significant figures.
A zero that is between two nonzero digits1023, 1.023, .1023 all have 4 significant figures.
Zeros that occur AFTER the decimal place are significant123.0 has 4 significant figures. 123.00 has 5 significant figures.
All zeros to the left of the first nonzero digit are NOT significant.00123 has 3 significant figures.
Zeros that occur without a decimal are NOT significant1230 has 3 significant figures

Exact and Inexact Numbers
Exact number are number that have a definite value. Counted numbers and metric conversions are exact numbers. The number of marbles in a jar, the number of people in a room are exact. Inexact numbers are numbers that do not have a definite value. An example would be a measurement taken with a set of vernier calipers. The vernier calipers dial is graduated at a thousandth of an inch. Lets say you measure the thickness of a washer and the indicator falls between 0.062 and 0.063 inches. We can say for certain that it is 0.062 because the indicator is above the 0.062 inch line, however we can not say for certain that it is 0.063 because the indicator falls below the 0.063 inch line. So we estimate the final digit. Lets say it’s around .0627. “0.062” are exact digits because we know for certain its at least 0.062 inches thick. However, the “7” is an estimated digit. One colleague may say it’s closer to 0.0626 and another 0.0628. The last digit is estimated and therefore the measurement is uncertain. All measurements are uncertain and therefore an inexact number.

Now, let say you measure the thickness of the washer with the same vernier calipers and the indicator falls right on the 0.062 line. If you recorded your results as “0.062” you would not be accurately stating the precision of your caliper. You are showing that you are only certain to 0.06 and the “2” is uncertain. In this case you would include the trailing zero and write your measurement as “0.0620” which shows the “0.062” as your certainty and the “0” as your uncertainty.

Significant Figures in Multiplication
When multiplying and dividing numbers, the number of significant figures in your answer will be equal to the number with the least significant figures. Let’s divide 123 by 3.14159 which equals 39.152149071. In this example, 123 has 3 significant figures and 3.14159 has 6. Therefore the answer can only have 3 significant figures.

Significant Figures 01

Note that exact numbers like 10mm in a centimeter have an infinite number of significant figures. We do not write the significant figures down and these numbers are not used in determining the number of significant figures to be used in your answer.

Significant Figures in Addition and Subtraction
To determine the number of significant figures in an addition or subtraction problem it is necessary to round the number too the same digit as the number with least digits to right of the decimal place. The number of decimal places will determine the number of significant figures to be used in the answer. For example, 29.4165 has 4 significant digits to the right of the decimal place and 234.65 has only 2. Therefore your answer will be rounded off to the 2nd digit after the decimal place.

Significant Figures 02

Expressing Uncertainty of Measurements
How precise the final answer will be is determined by the least precise measuring instrument used and how the final uncertain digit is expressed. For example on digital readouts my last digit is always inexact and therefore uncertain. A digital readout with a resolution of 0.0005, 4th digit is either a “0” or “5”, the 4th digit is my uncertainty. A digital scale with a resolution of 0.00001 lbs. My 5th digit is the uncertainty.
If a measurement is taken with a set of dial calipers with a resolution to 0.001 inches, the measurement would be recorded to the ten thousandth of an inch to show your uncertainty at the 4th digit because you can estimate the 4th digit when the indicator falls between two lines. Keep in mind that the final digit of any measurement is uncertain. If your measurement with the same instrument read exactly 2.1 inches and you recorded it as ”2.1 inches”, this show an incorrect uncertainty. “.1” being your final digit is the expressed uncertainty and expression shows it was measured with a device that only measures in 1 inch increments. The correct way to record your measurement with this instrument is 2.1000. This shows it was measured with a device that measures to 0.001 inch. Even though “2.1” and “2.1000” are the same measurement, the expressed uncertainty of measurement is not.

Significant Figures in Measuring
A simple density calculation is used to illustrate the use of significant figures. An object weighs 16.5 grams and has a volume of 9.3 milliliters. The formula for calculation is Significant Figures 05. By inserting the appropriate values we’ll illustrate how this works.

Significant Figures 03

In this example, 16.5g has 3 significant figures and 9.3mL has 2 significant figures. Using the rules of multiplying and dividing with significant figures, the answer would have the same number of significant figures as the least number in the calculation. Therefore, the answer should be reported using 2 significant figures, 1.7g/mL.

Let’s try another density calculation. We have a rectangular rubber block and want to calculate the density to determine from what type of elastomer it is made. To calculate the volume of a rectangular rubber block I need to use the formula Length X Width X Height (LxWxH). I will substitute this for volume in the density formula.

Significant Figures 04

A scale will be used to measure the mass and calipers to measure the dimensions of the block and calculate the volume. The scale has a resolution of 0.001 grams and the calipers have a resolution to 0.01mm. The results of the measurements are as follows:

InstrumentMeasured Value
Scale with .001g Resolution372.561g
Digital Calipers with .01mm ResolutionLength = 10.00mm
Width = 10.00mm
Height = 30.00mm

Note that the length, width and height values are recorded to 2 decimal places and the mass to 3 decimal places as these are the resolutions of instruments used and therefore want to show the uncertainty of measurements in the final answer. For example, if the measurement was recorded as 10mm, which has 2 significant figures, as opposed to 10.00mm, which has 4 significant figures, the measurement would not be expressing the proper uncertainty of measurement.

We want our density value in grams per cubic centimeter because the known density’s of rubber is specified in grams per cubic centimeter not grams per cubic millimeter, it is therefore necessary to convert the length, width and height measurements from millimeters to centimeters. 10.00mm divided by 10 mm/cm = 1.000cm. Because 10mm/cm is an exact number with infinite number of significant figures, it’s not used in determining the number of significant figures in the answer. Therefore, the number of significant figures is determined using measurements, which have 4 significant figures, so the final values can only have 4 significant figures, 1.000cm, 1.000cm and 3.000cm.

Let’s plug in the values into the density formula and calculate the results using significant figures. Using the measured values in cm, the density is calculated:

Significant Figures 06

Significant Figures 07

Significant Figures 08

The answer has 4 significant figures because the least number of significant figures in any number used is 4. Note that the numbers in the formula have the unit of measure which are also calculated out in the final answer. For example, in 1.000cm X 1.000cm X 3.000cm, the 3 “cm” are expressed as “cm3”. In the final value we have “grams” divided by “cm3” expressed as “g/cm3”.

It is good practice to include significant figures in your calculations to show the uncertainty of your measurements so other know the precision at which you were able to measure. It is also good practice to always include the unit of measure in your values. These will be calculated out in your formula and used to determine the proper unit of measure in your final answer.

Shelf Life & Proper Storage of Elastomeric Seal

Posted on

Shelf Life & Proper Storage of Elastomeric Seal

Written by Dale T. McGrosky

Proper Storage

As rubber seals age the physical properties change and can cause the seals to be unusable. These changes are caused by many factors such as light, ozone, humidity, etc. These factors can cause the rubber to harden, soften, crack or cause other surface degradations. Proper storage is needed to reduce the effects these factors have on the rubber.

Proper storage is essential in extending the shelf life of O-rings. Rubber seals and molded rubber products, whether in bulk or in assemblies, should be places in sealed bags and kept in boxes out of sunlight and excessive temperatures and humidity. Temperatures should be higher than 59°F and below 100°F. 68°F-70°F is optimal with the humidity no greater than 75%, 65% for polyurethane seals.

When O-rings are exposed to extreme cold below their normal operating range they can Harden and there shape can become distorted. The effects of extreme cold are not damaging to most elastomeric seals and they usually return to their normal when they warm up. Exposure to excessive heat can accelerate the deterioration of the rubber. The effects caused by excessive heat usually are not reversible.

History of Age Control

Age control of elastomeric seals and assemblies started after World War II on hydraulic, fuel and lubrication seals on aircrafts. The first document on age control was release in 1958 and was a compilation of several studies on age control done since WWII. After several more studies and papers, MIL-STD 1523 was released in 1973 and gave 12 quarters as maximum shelf life. This was extended to 40 quarters in 1984 with the release of MIL-STD-1523A. This standard was cancelled in 1995 when the release of AS1933 was issued. AS1933, “Age Controls for Hose Containing Age-Sensitive Elastomeric Materials” only addressed elastomeric hoses and seals were essentially released from control.

To meet the demand of contractors and address the confusion of age control of elastomeric seals since the cancellation of MIL-STD1523A, ARP5316 was issued and addresses shelf life, traceability, proper storage and gives a reference source to work with.

ARP5316, Recommended Shelf Life
MaterialShelf Life, max
Chloroprene CR15 Years
Acrylonitrile Butadiene BN, NBR, N15 Years
Fluorocarbon FKM, VUnlimited
Butyl IIRUnlimited
Ethylene Propylene EPR, EPM, EPDMUnlimited
Silicone VMQ, MVQ, SILUnlimited
Fluorosilicone FVMQ, FMVQ, FSILUnlimited
Polytetrafluoroethylene PTFEUnlimited
Perfluorocarbon FFKMUnlimited
Polyurethanes AU, EU2 to 5 years

Physical Properties of Rubber

Posted on

Physical Properties of Rubber

Written by Dale T. McGrosky

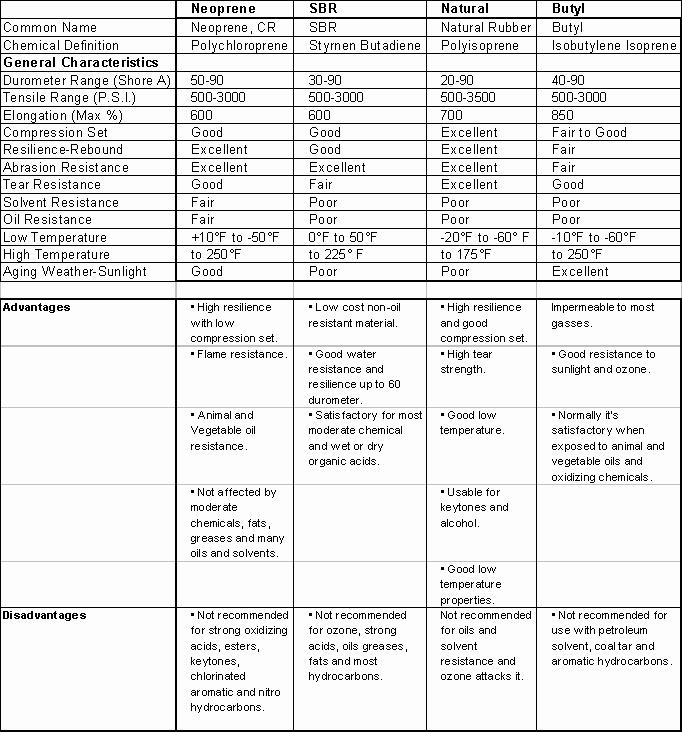
In this article we will describe the physical properties of rubber that you will see on a physical property data sheets for elastomers that are tested to ASTM D2000 specifications. I have described what the property is, why it is important, and how you test it. There are many more physical properties of rubber than what are described here, but, we will limit them to the most common physical properties you will see in the ASTM D2000 standard.

First we will cover Hardness, Ultimate Tensile Strength, Elongation, Tensile Set, Young’s Modulus and Yield Strength. The results of these properties, except Hardness and Tensile Set, are from tension stress which is recorded on the stress-strain curve that is generated during a Ultimate Tensile Strength test. Later will cover Tear Resistance, Compression Set, Ozone Resistance, Fluid Resistance, Low Temperature Resistance were sheer and compressive forces are applied to the specimen. ASTM D1043 and D1053 are used to measure the stiffness (modulus of rigidity) of a sample while
applying torsional force on a specimen chilled to a specific temperature.

Forces

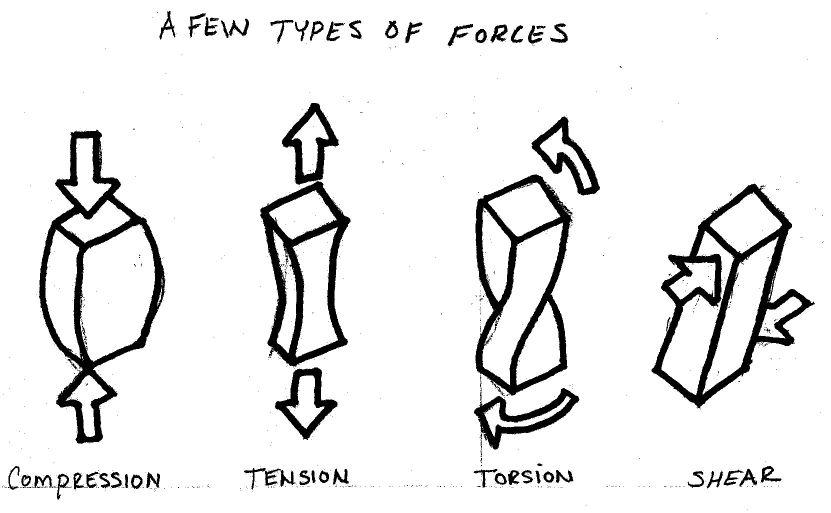
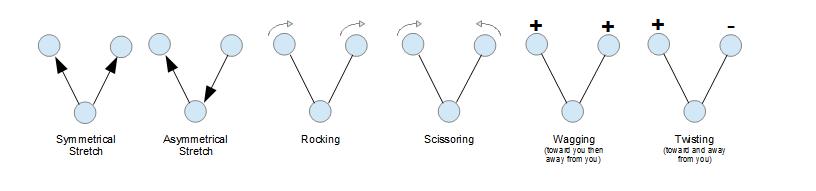
Figure Caption “Figure 1 – Types of Forces”

Lets take a quick look at some forces before we get started on explaining properties. These forces will be applied to the specimen during testing. Being familiar with these will also give you and
understanding of the forces that may be applied to the rubber parts while in your application.

Lets take a rectangular block of rubber as a specimen. If you squeeze the small sides together this is  compressive force. If you stretch the block, this is tension or tensile force. If you twist the block this is torsional force and if you apply an opposing force to the side on top and opposite side on bottom, this is shear force. Some of these forces will be applied to the specimen during testing.

Hardness

Hardness is the measure of how resistant solid material is when a force is applied. There are 3 main type of hardness measurements, scratch, indentation and rebound. We will only be talking about the indentation hardness for elastomers. Indentation hardness is the materials resistance to indentation by an indentor.

Rubber is made in different hardness’ for several reasons. Some sealing surfaces may not be totally smooth. The little voids, pits and scratches allow a pathway for fluid or air to escape through. Softer materials tend to flow better into these voids and imperfections on the sealing surface creating a better seal. On the other hand, harder rubbers will not do this as well but they do resist extrusion cause by high pressures. Also, coefficient of friction is also affected by the hardness of the rubber. Softer rubber has a higher coefficient of friction and harder rubber has a lower coefficient of friction. Coefficient of friction plays a factor when the rubber seal is sealing a part that moves.

Testing Hardness

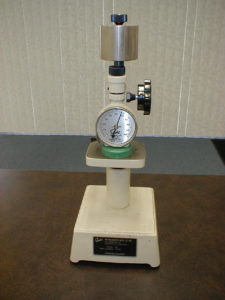
The durometer gauge is used to test the hardness of elastomers. The 3 most common durometer gauges used to measure rubber are Type A, Type M and Type D. Type A is used to test soft rubber materials while Type D is used to test hard rubber and plastic materials. Type M, also for soft materials, was developed to test small specimens, typically O-rings, that do not meet the physical size requirements specified in ASTM D2240. Is is important to know that although each of the hardness scales are graduated from 1-100, these scales are not the same. 90 Shore A is not the same as 90 Shore D or 90 Shore M. A piece of rubber measuring 90 on a Shore A gauge will read around 42-43 on a Shore D gauge.

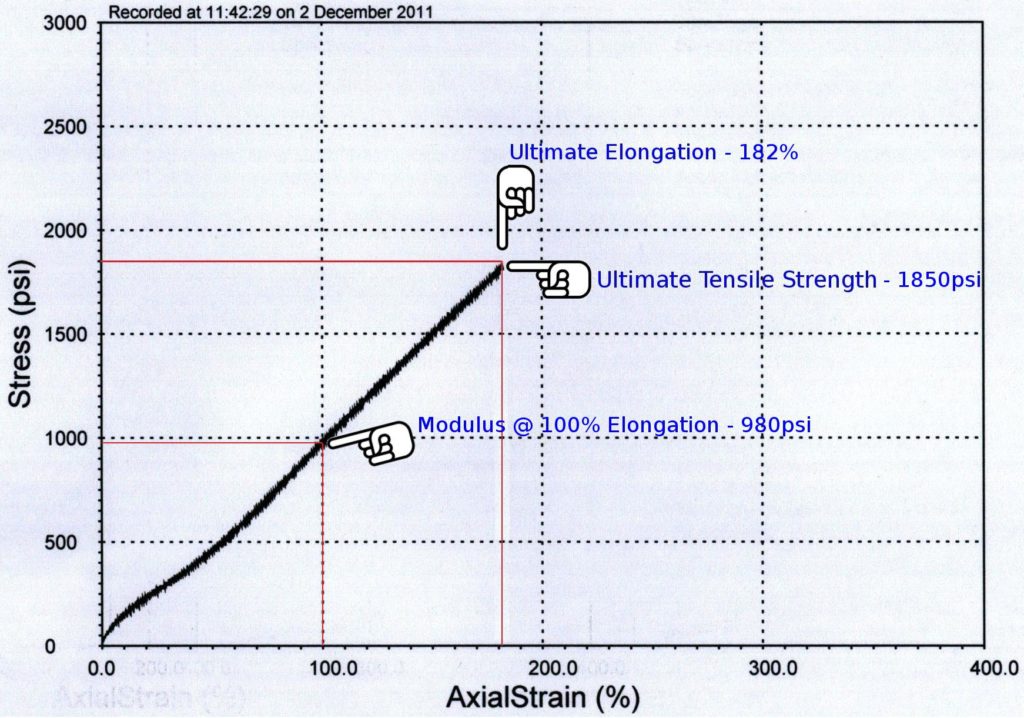
Figure Caption “Figure 2: Stress-Strain curve showing Ultimate Tensile Strength, Ultimate
Elongation and Modulus @ 100% Elongation”

Tensile Strength

Ultimate tensile strength, or just tensile strength, is the maximum force a material can withstand without fracturing when stretched. It is the opposite of compressive strength. Have you ever purchased a pair of shoes and they came joined together with a piece of string? Instead of getting a pair of scissors, did you opted to test your physical strength against the tensile strength of the string and try to break it by pulling on it? If the string has a low tensile strength you should be able to pull and break the string easily. You can apply more tensional force than the string can withstand. If it has a high tensile strength it will be much harder to break by pulling. Are you starting to understand tensile strength?

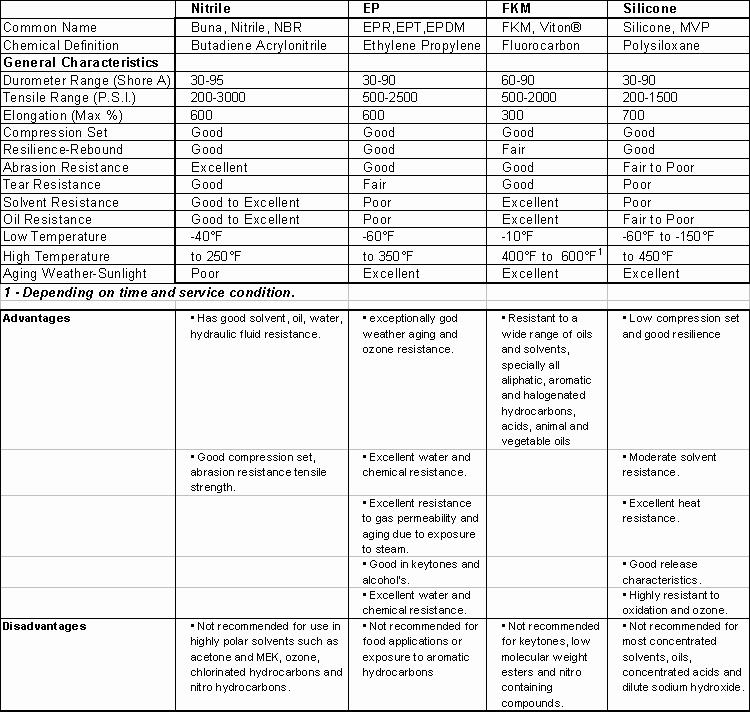
Tensile strength is an indication of how strong a compound is. Any time you have an application where you are pulling on the part, tensile strength is important to know. Whether your product is designed to break easily or not at all the tensile strength will let you know how the object will react to the tensional forces. A few rubber products that tensile strength are important would be bungee cords, rubber tie downs, drive belts. Some elastomeric compounds, like Silicone, have a low tensile strength making them unsuitable for a dynamic types of seal because they can fracture easily.

Measuring Tensile Strength

Tensile strength is measured with a tensometer. A tensometer is special machine that is designed to apply a tensional or compressive force to a specimen, in our case a die cut dumbbell shape, and measure how much force it takes to deform and fracture the specimen. The force is typically displayed on a stress-strain curve that shows how much force was required to stretch the specimen to deformation and ultimately break.

Elongation

Maximum elongation, with respect to tensile testing, is the measure of how much a specimen stretches before it breaks. Elongation is usually expressed as a percentage.

I had an application where a very small O-ring with an inside diameter of .056 inches had to stretch over a rod with a diameter of .170 inches. A Nitrile O-ring worked fine since it’s ultimate elongation was well over 400% and the O-ring was able to withstand the 200% stretch during installation. But when we tried to use a fluorocarbon compound several of the O-rings were breaking during installation. This fluorocarbon compound had an ultimate elongation of 150% and could not withstand being stretched to over 200% during the installation and the o-ring would break.

Measuring Elongation

Elongation is measured with a ruler or an extensometer. An extensometer is an electronic ruler that is attached to the tensometer and will measure the extension of the specimen while torsional force is being applied. Another way of measuring elongation is with a regular ruler. To measure the elongation with a ruler, make two bench marks 1 inch a part on the specimen. This is the Initial Gage Length (Lo) and then measure the distance between the marks just before the specimen breaks. This is the Final Gage Length (Lx). Calculate the elongation with the following equation:
elongation % = 100( Lx – Lo ) / Lo.

Tensile Set

While we are using bench marks, let quickly talk about Tensile Set. Tensile Set is the extension remaining after a specimen has been stretched and allowed to relax for a predefined period of time. Tensile Set is expressed as a percentage of the original length. Tensile set results are not found on the stress-strain curve. It’s a measurement that can be performed after the tensile strength test. Do not mistake Tensile Set with Elasticity. Elasticity is the mechanical property of a material to return to its original shape where Tensile Set is the amount on extension remaining after being stretched.

A rubber band would have a low Tensile Set percentage. After stretched it relaxes close to, if not exactly to, its original length. Now take a piece of Teflon and stretch it. It does not return to its original length and it stays in its stretched state. This would have a high Tensile Set percentage.

One test we perform in our Q.C. inspection is to pull on the O-ring and see how fast and how close it returns to its original diameter. The O-ring should fairly quickly return close to its original diameter. Often times a seal has to be stretched during installation and the last thing you want to happen is the O-ring stay stretched and not fit which could cause problems during assembly.

Measuring Tensile Set

Remember the 2 bench marks 1 inch apart on the specimen in the elongation test? To determine Tensile Set after break, wait 10 minutes after the specimen breaks and then fit the two halves of the specimen back together so there is good contact along the full length of the break. Measure the distance between the bench marks. Use the same equation used in the elongation test except the Final Gage Length (Lx) is the final measured distance between the bench marks.

Another way to test without breaking is to stretch the specimen to a specified elongation and hold for 10 minutes. Release the specimen as quickly as possible, making sure not to allow it to snap back, and let sit for 10 minutes. Measure the distance between the bench marks. Again, use the same equation used in the elongation test except the Final Gage Length (Lx) is the final measured distance between the bench marks.

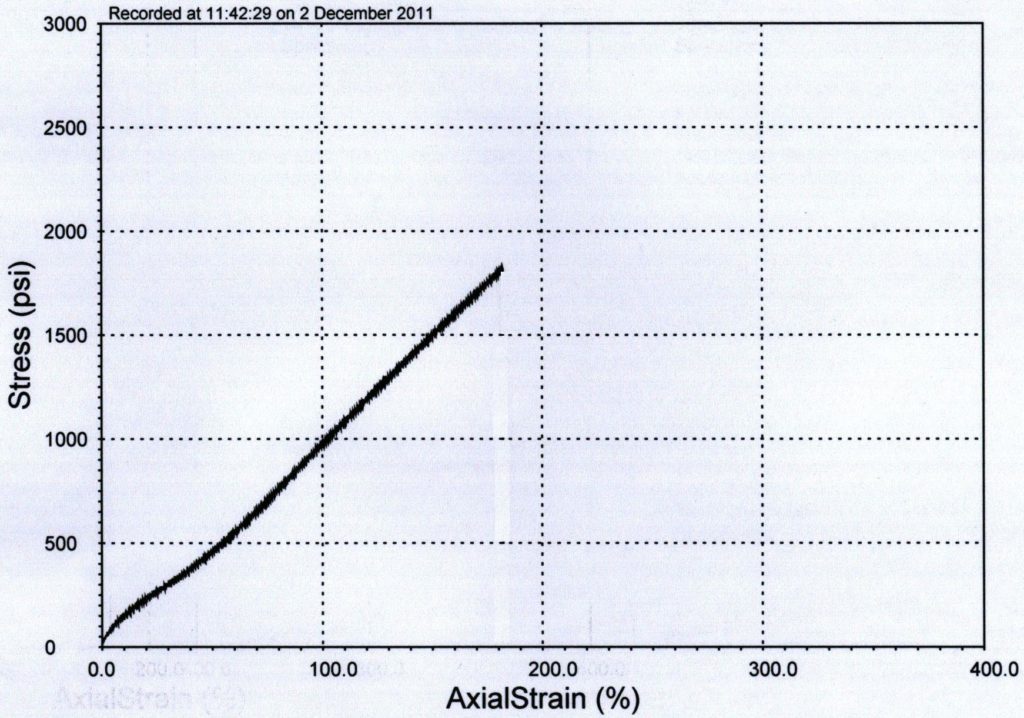
Figure Caption “Figure 3 – The steep slope would indicate this material is the tougher of the two material curves shown.”

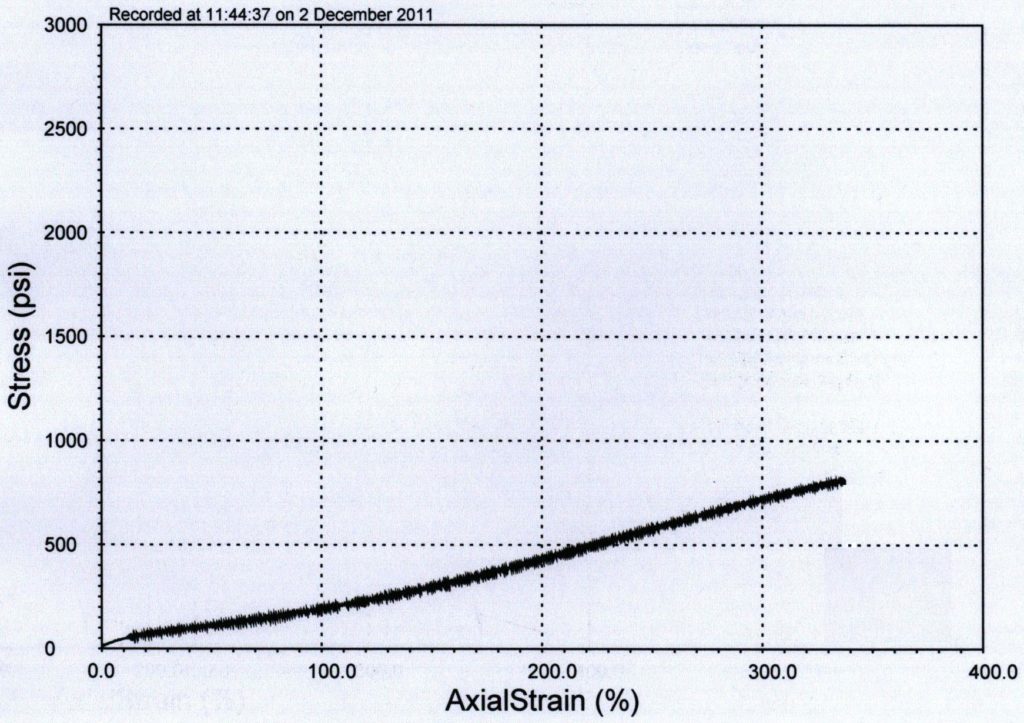
Figure Caption “Figure 4 – The shallow gentle slope shown on this curve would indicate this material is not very tough.”

Young’s Modulus

Young’s Modulus is also known as Tensile Modulus, Elastic Modulus and Modulus of Elasticity (“Measure” of Elasticity). It’s the measure of the stiffness of the material. You will see this on a physical property data sheet written something like “Modulus @ 100% Elongation.”

When performing a Tensile Strength test a plot is made of the stress vs. strain or amount of force required to stretch (deform) the specimen given length. This plot is called a stress-strain curve. The peak of the curve is the Tensile Strength and the Young’s Modulus is the slope of the stress-strain curve. If you have a steep curve the specimen resists deformation (it’s tougher) and a if the slope is gentle the material will deform easily.

At any given point on the stress-strain curve we can read the Tangent Modulus. “Modulus @ 100% Elongation” says we want to know the amount of force required to stretch (elongate) the specimen 100%. We can also ask for Modulus @ 200% or any given point on the stress-strain curve.

Knowing how easily a material deforms under strain can be important in some applications. An engineer was installing a rubber seal on a door. The rubber he used had high modulus. The door was hard to close because the rubber resisted being deformed. He then used a compound with low modulus that deformed easily allowing the door to close easily.

Measuring Young’s Modulus

Young’s Modulus is measured during a Tensile Strength test. As stated above, when performing a Tensile Strength test a stress-strain curve is plotted. The slope of this curve is the Young’s Modulus and any point on that curve is a Tangent Modulus.

Young’s Modulus (Linear Elastic Region) and Yield Point (Strength)

Yield Point

Yield Point is the force at which the specimen starts to deform permanently. It is difficult to point to the exact Yield Point on the curve because the transition is gradual, so a 2% offset (0.2% for metals) from the Linear Elastic Region is used to indicate the Offset Yield Strength. Although Yield Strength is meant to show the exact point where the specimen becomes permanently deformed, a 2% offset is an acceptable sacrifice because of how much easier it makes it to determine yield strength.
Just prior to the Yield Point is the Linear Elastic Region. The slope of the line in this region is called Young’s Modulus. This is the area which the specimen retains its elasticity. When the force is removed in this area the specimen will return to its original shape. After this area the specimen transitions from elastic to plastic behavior. This means that after the Yield Point, permanent deformation occurs in the specimen and it will no longer return to its original shape. Here is where I am going to throw a curve at you. In most elastomer stress-strain curves you will not see a definite yield point or plastic region. The elastomer specimen will remain in the linear elastic region throughout most of the curve as shown in the figures 3 and 4 except Urethane compounds shown in figure 5.

To summarize the above properties lets take a look at the stress-strain curve that is generated during the Tensile Strength test, see figures 2 and 5.

Ultimate Tensile Strength

The amount of tensional force required to fracture a specimen.
Ultimate Elongation – the amount a specimen deforms by stretching.
Young’s Modulus – The slope of the stress-strain curve that is generated during a tensile strength test.
Tangent Modulus – Any point on the stress-strain curve.

Yield Point

The force at which a material will begin to deform permanently.
Hardness – The measure of how resistant solid material is when a force is applied. There are 3 main type of hardness measurements, scratch, indentation and rebound.

Tensile Set

A measurement showing the extension remaining after a specimen has been stretched and allowed to relax for a predefined period of time. Tensile Set is not show on the stress-strain curve. Is is a measurement that can be done after a tensile strength test.

So far we talked about properties where tension force was applied to the specimen. Some of these properties were tensile strength, elongation, modulus, and yield point. Now lets talk about compression set, compression-deflection and tear resistance, where compressive and sheer forces are applied, as well as weathering, ozone and low temperature resistance. Lets get started with compression set.

Compression Set

The purpose of the compression set test is to measure the ability of the rubber specimen to retain its elastic properties after compressive forces have been applied for a prolonged period of time at elevated temperatures.

Compression set results can be useful to know when rubber seals, mounts or dampeners are subject to compressive forces in the application. This is particularly important when the seal is in a prolonged compressed state and even more so when simultaneously being exposed to elevated temperatures.

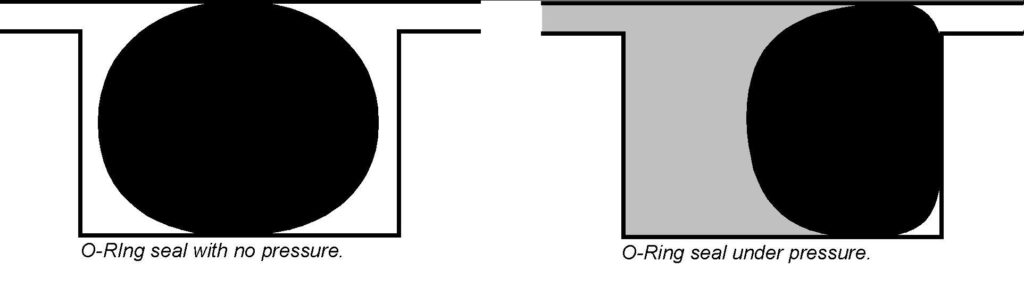
When an O-ring is squeezed the rubber has elasticity. It wants to go back to its original shape. This elasticity is how the O-rings seals, especially under low or no pressure. When pressure is applied to the system the O-ring seal pushes against the groove wall opposite the direction of the pressure, forcing it to expand perpendicular to the direction it is being squeezed. This expansion provides additional sealing capability. When an O-ring is squeezed and subjected to excessive heat it can loose some or all of its elasticity and take a permanent set. Then, when you pull the o-ring out it no longer has a nice round cross section but instead has flat spots were it was squeezed in the application. This permanent set will reduce the sealing ability of the O-ring. The compression set test is a great way to see how the compound will react to compressive forces while subjected to heat. Also, poor compression set along with poor tensile strength can be an indication of the state of cure of the specimen. If you don’t cure the compound enough these properties will diminish.

How to Test Compression Set

The specimen, usually a molded rubber disk, is squeezed between two metal plates to about 75% of its original thickness and then placed in an oven at elevated temperatures for a period of time. After the specimen comes out of the oven and is allowed to cool, measurements can be taken and the percentage of original deflection is calculated.

The original deflection is the amount you compressed the specimen in the fixture. If you have a 1 inch thick specimen and compress it to 0.750î thickness, the original deflection is 0.250î. Now lets say the 1 inch thick sample measured 0.875î thick after the test. It took a 0.125î set. 0.125 is 50% of the original deflection of 0.250î or a compression set of 50%. The higher the percentage the poorer the results.

You may see “Method A” or “Method B.” Method A is compression set under a constant force and Method B is compression set under constant deflection. Method B is the primary method used throughout the ASTM D2000 specification.

Compression-Deflection

The purpose of the compression-deflection test is to compare the stiffness of the rubber materials under a compressive force. This test can tell you how much a part will deflect under a given load or, alternatively, how much load it will take to deflect a part a given distance. Rubber mounts and dampeners are some examples of parts that are subject to compressive forces and knowing the relationship between compressive forces and deflection can be important.

How to Test Compression-Deflection

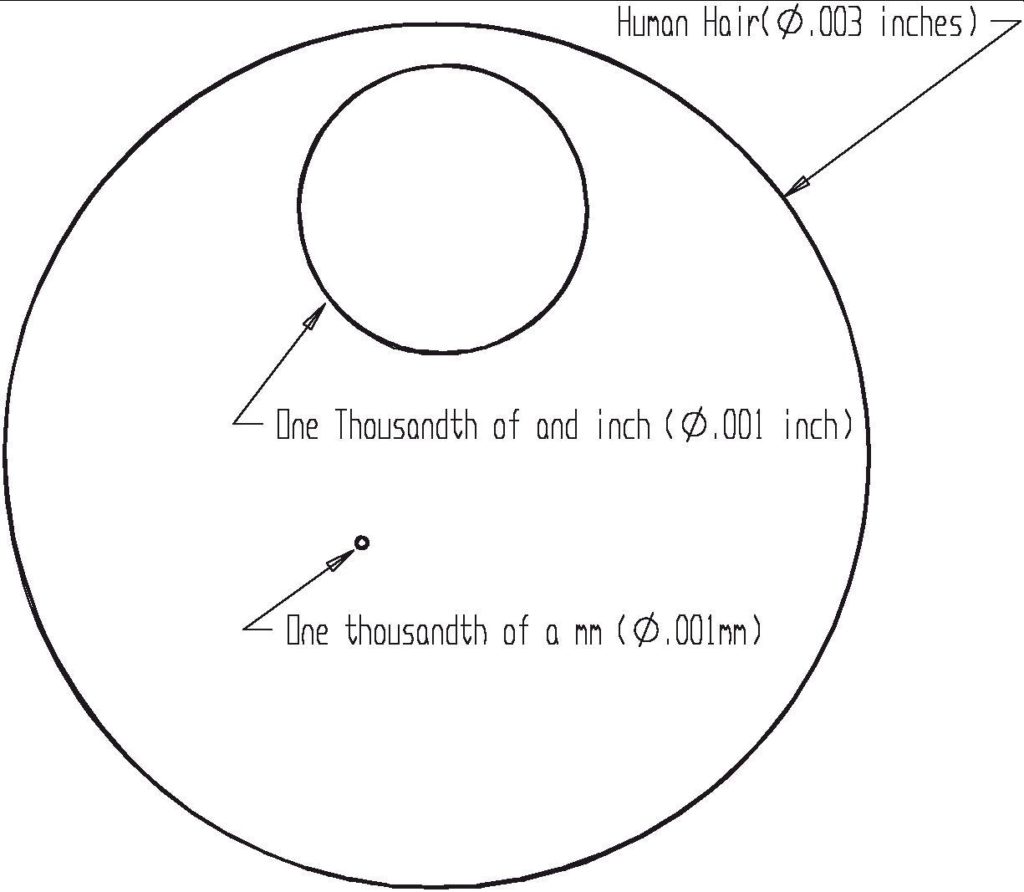
Compression-Deflection is measured on a compression testing machine or can be measured on any other type of machine that can apply a measurable force to a specimen at a given rate and be able to measure the deflection to one thousandths of an inch. At Satori Seal our tensometer can apply compressive force at the specified rate and also measure the deflection. The test is performed by compressing the specimen to a specified compressive force and measuring the deflection results or compressing to a specified deflection and measuring the compression force results.

Tear Resistance

The tearing of rubber is a mechanical rupture process started where forces are concentrated in an area usually caused by a cut, defect or deformation.

How to Test Tear Resistance
Tear resistance is tested on a tensometer in the same manner as the tensile strength test except the specimen is one of 5 specific shapes: Type A, B, C, T or CP. A graph is produced in the same manner as the stress-strain curve except the Tear Strength graph is force over jaw separation length. Tear strength is calculated by taking the maximum force divided by the median thickness of the specimen (Ts = F/d).

Type A – Crescent shaped specimen with a nick or cut
Type B – Tab End specimen with a nick or cut
Type C – Right Angle specimen with a nick or cut
Type T (Trouser) – Molded block, 150 X 15 X 2mm, with a 40mm cut
Type CP (Constrained path) – Molded specimen 125 X 28.5 X 5.33mm. This is a special molded shape with fabric reinforcement molded in the mid-plane of the sample. The specimen has a narrows groove down the length in the center.

Ozone Resistance

Ozone (O3), resistance is used to test the relative ability of the rubber compound to resist outdoor weathering or ozone chamber testing. Some applications like door and window trim would be subject to weathering so testing would give an estimation of how the rubber compound will react to weathering. Other sources of ozone exposure include air purifiers and ozone generators used to purify, deodorize, disinfect and kill bacteria in just about everything from air to food.

How to Test Weathering/Ozone Resistance

ASTM Method D1171 addresses how to test weathering and ozone resistance. In D1171, rectangular cross section samples are wrapped around a wooden mandrel and left in the sun or placed in an ozone chamber. After a period of time either method A or method B is used to grade the samples. In method A no cracking is permitted under 2X magnification and in method B, three samples are checked and graded depending on the severity of cracking and given a quality retention value (expressed as a percentage) derived from Table 1 in ASTM D1171.

ASTM Method D1149 is used to test the effects of specific levels of ozone concentration on specimens that are under dynamic or static surface strain conditions.

Low Temperature Resistance

There are two low temperature tests that are used in testing low temperature properties of elastomers, ASTM D2137, Low Temperature Brittleness, and ASTM D1379, TR-10/TR-70 Temperature Retraction test. Low Temperature Brittleness is the most common low temperature test you will see on a physical properties data sheet. The temperature retraction test is not as common but will give you more accurate continuous operating low temperature results and a better indication of the viscoelastic and crystallization effects at low temperature.

ASTM D2137 – Low Temperature Brittleness

The Low Temperature Brittleness test is use to determine the lowest temperature at which a rubber specimen will not exhibit fractures or cracks when subject to a specific impact condition. There are two tests methods, A and B. Test Method A is for rubber volcanizates and Test Method B is for rubber coated fabrics. This test is useful for development purposes but may not necessarily indicate the lowest temperature at which the compound will operate. The TR-10/TR-70 Temperature Retraction Test is more effective in determining the lowest temperature at which a compound will continue to operate.

How to Test Low Temperature Brittleness

Specimens are cut from a die and placed into a fixture. The specimens are immersed into a liquid bath at the specified test temperature for a determined length of time. After immersion deliver a single impact to the specimen and note any cracks, fissures or holes visible to the naked eye. Repeat the test at the next highest temperature (usually 10∞C increments) until the specimen passes with no cracks, fissures or holes.

ASTM D1379 – TR-10/TR-70 Temperature Retraction

The TR-10/TR-70 Temperature Retraction test is used to evaluate the crystallization effects and viscoelastic properties of the rubber specimen at low temperature. This test will give you a better indication of compounds lowest temperature at which it will continuously operate.

How to Test TR-10/TR-70 Temperature Retraction

This test is performed by stretching a die cut specimen in a special fixture to 250% elongation or 50% of the ultimate elongation if 250% can not be obtained. The stretched specimens are immersed in in a liquid at -70∞C for 10 minutes freezing the sample to a state of reduced elasticity. Now, after releasing the specimens, slowly raise the temperature of the samples and measure the temperature and length of the specimens at 2 minute intervals. Report the temperature at which the sample retracted 10% (TR10), 30% (TR30), 50% (TR50) and 70% (TR70).

The TR10 value can be used to indicate the low temperature at which it will continuously operate, and it also correlates with the brittle point. The greater the temperature difference between the TR10 and TR70 the greater the tendency of the rubber to crystallize. TR70 also correlates with low-temperature compression set.

Understanding the physical properties of rubber will help you determine what properties are important to your application.

Introduction to O-Rings

Posted on

Introduction to O-Rings

Written by Dale T. McGrosky

What is an O-Ring?

An O-ring is a donut, or torus shaped seal typically used to prevent the passing of air or fluid. In other words, O-rings are used to keep fluid or air IN or OUT of a defined space. For example, My underwater camera uses O-rings to keep water out and my SCUBA regulator uses O-rings to prevent precious air from escaping. O-rings can be used for more than preventing air or fluid from passing, they are also used as drive belt, decorative objects on furniture, cups and automotive parts and also used as body jewelry.

How Does an O-ring Seal Anyway?

Before we go over types of materials, hardness, sizes and tolerances of O-rings lets talk about how the O-ring actually seals. Basically an O-ring is used to block a pathway that fluid or air may escape through. O-rings are usually put into a groove to hold them in place and then squeezed between two surfaces. When you squeeze the o-ring between two surfaces you are taking up the clearance and blocking the pathway that the fluid or air wants to escape through. When an O-ring is squeezed the rubber has a memory. In other words it wants to go back to its original shape. This memory is how the O-rings seal under low to no pressure. When pressure is applied to the system this also helps the O-ring seal by pushing the o-ring against the groove wall opposite the direction of the pressure and forcing it expand perpendicular to the direction it is being squeezed by the pressure. Wow, what a mouth full. Lets see if we can explain that a little more simply. Take a water balloon, for all practical purposes water is not compressible. When you squeeze the water balloon between your hands it expand in the opposite direction. Go ahead and get a water balloon and try it. The O-ring does the same thing in the groove. Pressure squeezes the o-ring against the wall of the groove forcing it to expand in the opposite direction helping the o-ring to seal against the walls of the groove (See the diagram below). Starting to get the picture?

Sizes

In most cases, O-rings are sized by the inside diameter (I.D.) then by the cross section (C/S) or width (W). When you call out an O-ring by its size you would give the I.D. first then the C/S second. Like this: 1.239X.070 inches. This is also how metric O-rings are called out. For example: 25.50X2.50. The reason for calling the I.D. instead of the O.D. is the I.D. is what has the tolerance on it (We’ll talk more about tolerances later). The O.D. is usually given as a reference only.

You may have noticed that on the metric size we only went to the hundredth decimal place, or 2 digits past the decimal point (.01) and on the inch size we went to the thousandth decimal place, or 3 digits past the decimal point (.001). A thousandth of a millimeter (.001mm) would equal .000039 inches which is really too small to be concerned about for O-rings (See diagram). You can convert inches to mm and vice versa by these formulas. Inches X 25.4 = mm and mm X .03937 = Inches.

O-Ring Size Standards

You probably have run across someone calling for a dash number like -012 or ñ213 when they reference an O-ring. These “Dash Numbers” are actually from Aerospace Standard AS568B that assigns a dash number and tolerances to a size of o-ring, I.D. X C/S. AS568B size O-rings, commonly referred to as standard size O-rings, are probably the most common used here in the US and pretty much found everywhere. But, it doesn’t stop here, there are several other size standards throughout the world such as DIN3771, British Standard (BS), Japanese Industrial Sizes (JIS-B-2401) and many others.

Tolerances

Since O-rings can not be made exactly to their dimensions every time, manufactures are allowed to make them within range of their original dimensions. Variations in the rubber compound and in the manufacturing process cause slight variations in the shrink of the material and effect the finished size of the O-rings. Note that O-rings are made larger because they shrink in the mold and during the post curing stage. These variations make it difficult to mass produce O-rings to their exact dimensions so the need for tolerances comes in. Tolerances can be expressed in several different ways. The most common is a “±” figure like 1.239 ± .011. Others state a range that is acceptable for a dimension, like 1.228-1.250 inches. Therefore 1.239± .011 is the same as 1.228-1.250. (Go ahead, do the math, my boss made me double check this.) Tolerances play an important part in seal design but weíll discuss this in a future article.

Type of Elastomers

O-ring seals are commonly made of rubber but they can also be made with plastic or metal. 36 different types of rubber compounds exist on the market today because of the different temperatures, chemical exposures and environments that O-rings are subjected too. For instance, Nitrile, also called Buna, resists oils and greases very well but will not last when exposed to sunlight or ozone. On the other hand ethylene propylene has good resistance to sunlight and ozone but is not good with hydrocarbon based oils and greases. Temperature range also plays a major role in material selection. Some applications require a material with a low temperature range. An air conditioning unit may see temperature as low as -40∞F or more, some Nitrile works to -55∞F, while other applications may go as high as 600∞F or more. In this case silicone may be a good choice. For more information on material selection see the Material Characteristics Chart in this document.

Rubber Hardness

Figure Caption “Durometer gauge with conveloader stand. The conveloader helps to make the durometer readings more consistent by controlling the force and rate which is applied to the gauge as well as keeping it perpendicular to the sample being tested.”

Now that we went over types of elastomers and temperature ranges there is one more property of the rubber you have to consider when choosing an O-ring — the hardness of the rubber. Rubber material can be made very soft, a low durometer reading, to very hard, a high durometer reading. The hardness is usually called out in increments of 5 durometer points, for example 60, 65, 70 and so on. The hardness of rubber also has a tolerance of ±5 points. This is due to the fact the hardness is hard to control because of all the variables involved in the compounding and the manufacturing process. You want to know some of the variables? Well, each of the ingredients of the rubber compound vary slightly from batch to batch not to mention the when you mix all the ingredients together to make the rubber compound will also vary from batch to batch. Add this to the variables in manufacturing like temperature of the mold and ovens, time in press and oven and so on can cause the hardness to vary. Therefore manufactures ask for a tolerance of ±5.

Rubber is made in different hardnesses for several reasons. Some sealing surfaces may not be totally smooth. The little voids, pits and scratches allow a pathway for fluid or air to escape through. Softer materials tend to flow better into these voids and imperfections on the sealing surface creating a better seal. On the other hand, harder rubbers will not do this as well but they do resist extrusion cause by high pressures. Softer rubbers tend to extrude into the clearance between the two parts being sealed when exposed to high pressure causing a failure of the O-ring seal.

Coefficient of friction, either static, breakout or running friction is also effected by the hardness of the rubber. Softer rubber has a higher coefficient of friction, meaning if you take a piece of rubber and try to slide it across the surface of your desk. The higher the friction more force is needed to make it move and keep it moving. Coefficient of friction plays a factor when the O-rings are sealing a part that moves.

Hardness of rubber is measured with a durometer gauge (see picture above). There are many scales of durometer gauges like type A, B, C, D, O, OO. These different scales are necessary to measure the hardness on different material such as soft rubber, soft plastic and hard plastic.

Durometer is the measure of how far an indentor penetrates the sample. The softer the rubber the more the indentor penetrates the sample causing a low durometer reading. The harder the rubber the less the indentor penetrates the sample causing a higher durometer reading. The durometer scales are from 1-100. Glass would give a reading of 100. Type A and M are the durometers used for rubber. Small O-rings can not accurately be tested using the type A gauge because of the small size and curvature of the O-ring. So there is a Type M durometer gauge. This durometer gauge has a smaller indentor and lighter spring that is suitable for checking the hardness of small thickness O-rings. Unfortunately you can not convert Type A to Type M or vice versa. There is no correlation between these scales.

There are many factors that effect durometer readings. Temperature, humidity, how much force is applied to the gauge, how fast the gauge is pushed down and when the reading is taken all play a part in what type of reading you will get. Many durometer gauge manufactures have a conveloader to reduce some of the variations by controlling the force and rate that is applied to the gauge. But note that it is not uncommon for two people to get two different reading from the same rubber sample and gauge. Durometer reading are only accurate to around ±2 so don’t get frazzled when the readings are not the same between you and your boss.

O-rings come in many sizes, hardness’, elastomers and colors to suite the particular application. If you need further assistance in choosing an O-ring seal please give one of our friendly customer service representatives a cal at 800-322-8366 and we will be glad to assist you.